PSI Performance 95+. Guaranteed if included in the quotation.
The guarantee covers the PageSpeed Insights Performance score at delivery, for the pages and conditions defined in the quotation. Field data is measured separately. This guarantee applies only if included in the quotation.
Performance optimisation starts with measurement, identifies the actual bottleneck and validates each change under comparable conditions. Lighthouse and PageSpeed Insights support diagnosis; field Core Web Vitals describe real experience when sufficient data is available. Also read the LCP, INP and CLS guide.
≤ 2.5 s
Good LCP
Google threshold at the 75th percentile
≤ 0,1
Good CLS
Google threshold at the 75th percentile
≤ 200 ms
Good INP
Google threshold at the 75th percentile
95+
PSI Performance
Guaranteed if included in the quotation, under the agreed protocol
kanexio.com · PageSpeed Insights
Performance, backed by evidence.
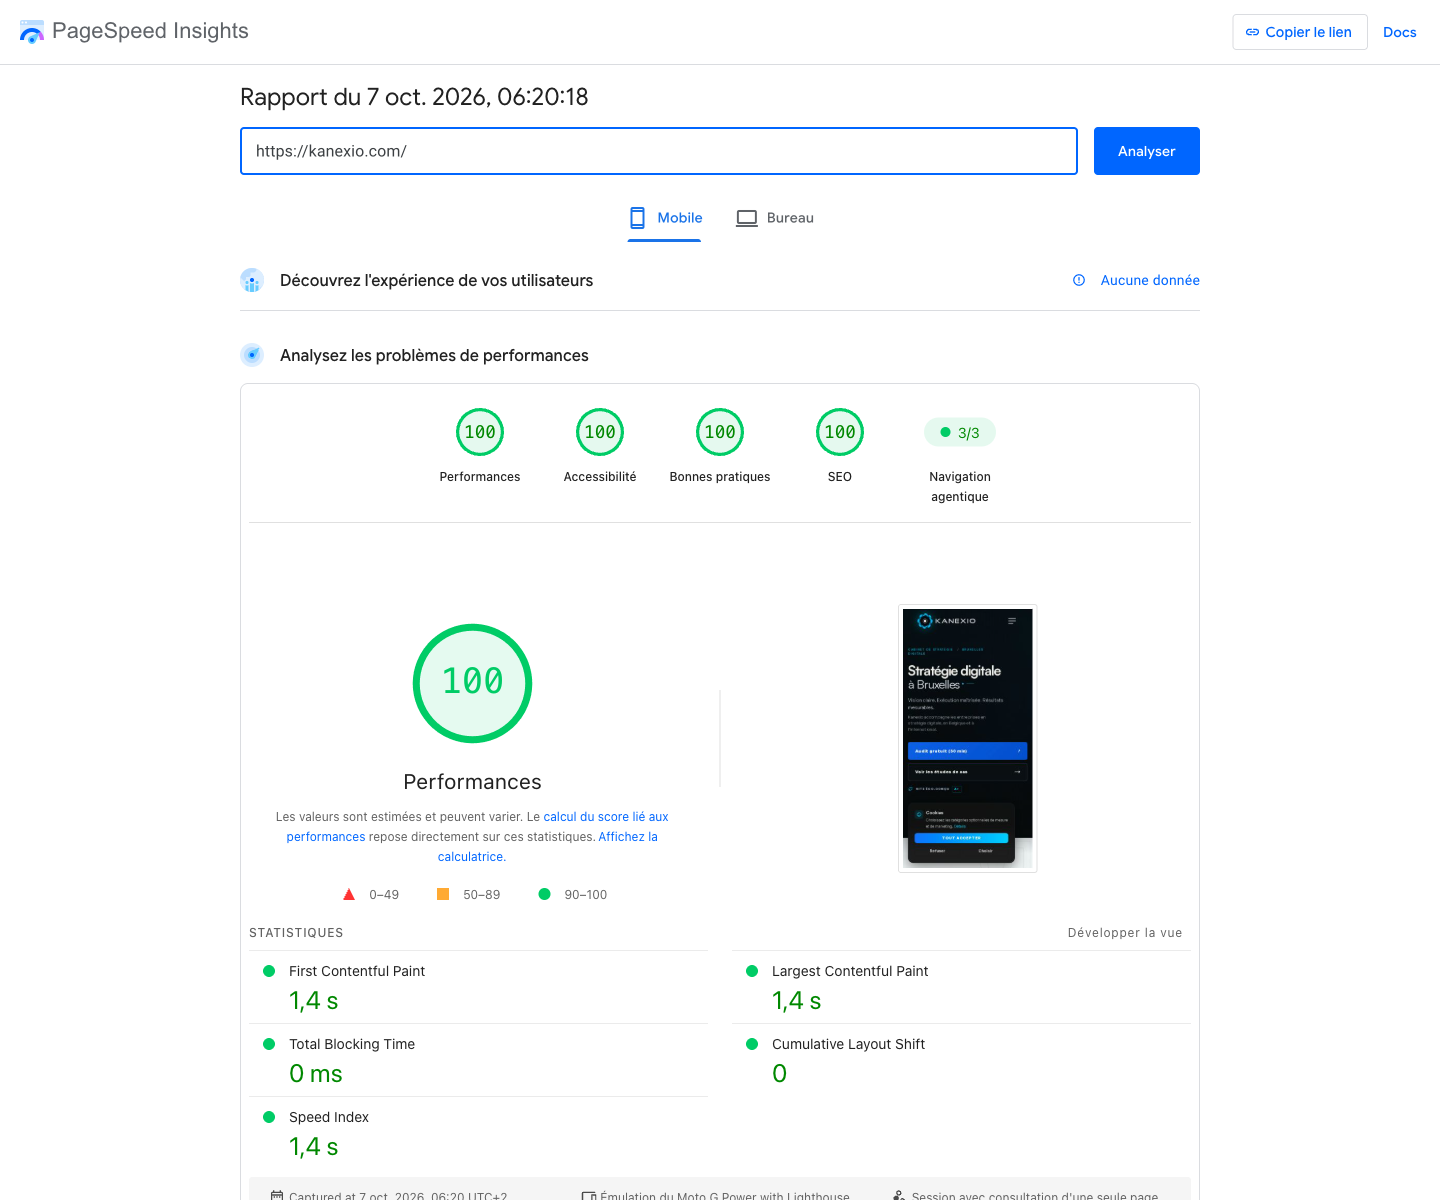
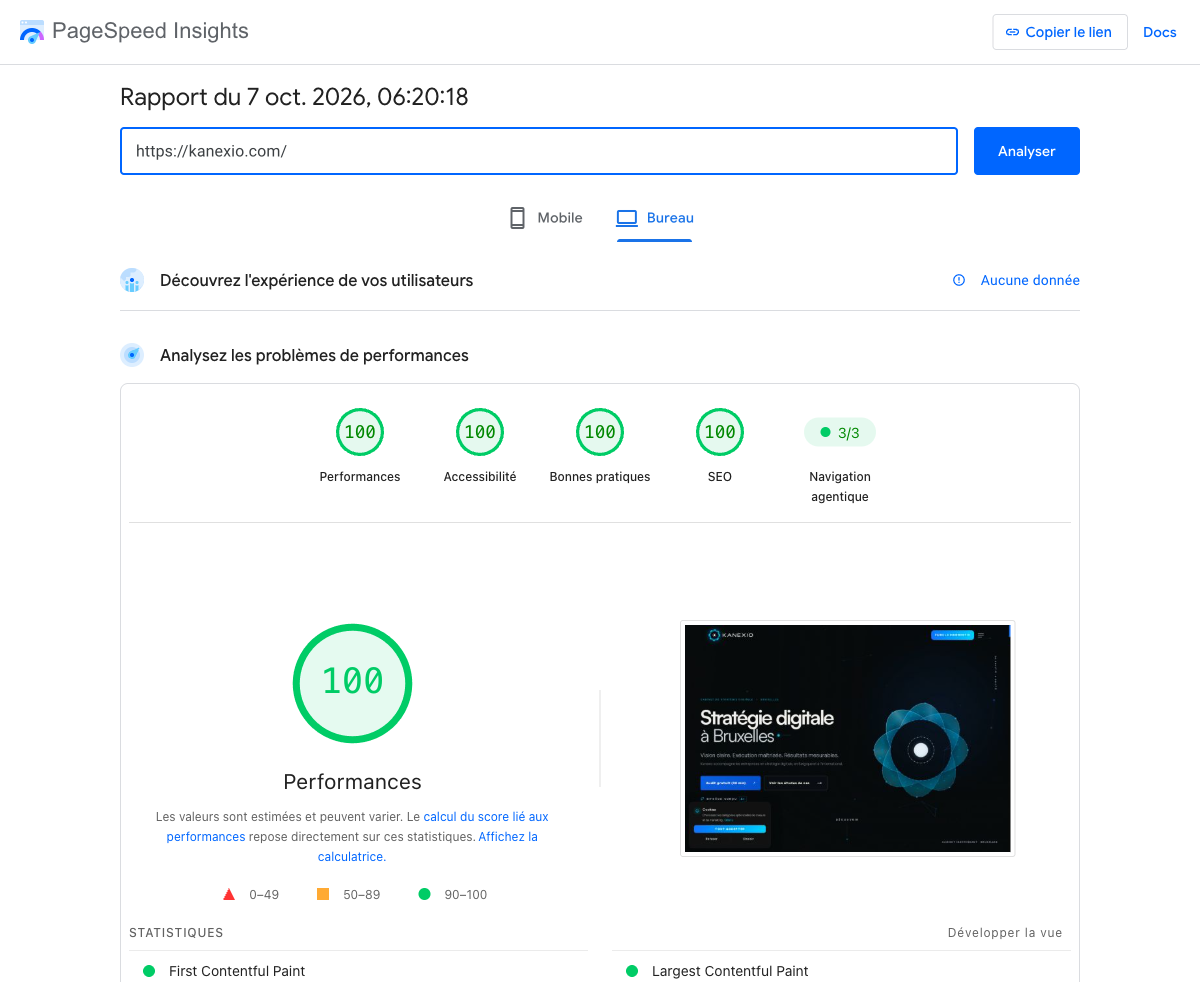
100/100 for performance, accessibility, best practices and SEO, on mobile and desktop.
These original screenshots document a dated lab test, using a simulated mobile device on a slow 4G connection and a separate desktop test. Scores may vary. The reports shown have no CrUX field data: these results demonstrate neither traffic growth nor guaranteed Google rankings. An automated accessibility score does not replace manual testing.
Documented changes
Measured progress over time.
From 15/03/2026 to 30/09/2026.
+400 %
Clicks from Google
Google Search Console
Web search, all countries and devices, including branded searches.
+1 400,8 %
Impressions in Google
Google Search Console
Web search, all countries and devices, including branded searches.
Sources and comparison method
The 30 days from 15/03/2026 to 13/04/2026 are compared with the 30 days from 01/09/2026 to 30/09/2026.
Reports consulted on 07/10/2026. The calculation compares two windows of equal length at the beginning and end of the history shown: (final value / reference value − 1) × 100, rounded to one decimal place. Raw volumes remain confidential.
These selected indicators do not summarise the site's overall performance or attribute the increase to a single intervention. They do not compare several months' cumulative totals with a single month.
INTERACTIVE TOOL
Performance self-assessment in 30 seconds.
Tick the criteria already in place. We calculate your self-assessed score and identify priority improvements.
My current criteria:
Self-assessed score
0
/100
Tick your criteria to see your score.
This checklist indicates which practices are in place. It does not predict a Lighthouse score or field data.
PSI Performance score of 95+ (if included in the quotation) guaranteed at delivery under the agreed protocol
Before-and-after measurements under a documented protocol
RUM monitoring for 30 days after delivery
Documentation of the optimisations applied
Optional or available separately
Visual redesign (separate service)
Framework migration (WordPress → Astro, on quotation)
Bulk optimisation of more than 500 existing images (optional extra)
Performance maintenance after day 30 (optional package)
Investment
Three performance packages.
Express audit
One-off assessment and action plan
950 €
Excluding VAT · Audit + 90-day plan
Complete Lighthouse audit
WebPageTest waterfall
Prioritised optimisation plan
1-hour presentation of findings
No implementation
Most requested
Optimisation Sprint
Existing website with identified priorities
€3,500 to €6,500
Excluding VAT · Audit + implementation
Audit + plan + implementation
Quick wins + structural optimisations
PSI Performance 95+ (if included in the quotation) guaranteed under the protocol
30 days of RUM monitoring where available
Documentation
Continuous Performance
Website to monitor over time
From €850/month
Excluding VAT · Commitment of 6+ months
RUM monitoring where available
Regression alerts
In-depth quarterly audit
Corrective optimisations included
Monthly reporting
Prices excluding VAT. Belgian VAT of 21% applies.
Frequently asked questions
All about web performance.
What does the PSI Performance 95+ guarantee cover?
Kanexio guarantees a PageSpeed Insights Performance score of 95 or above at delivery for the pages, version, device type and testing protocol specified in the quotation. Validation is dated and documented. This commercial guarantee does not cover CrUX field data, Google rankings, conversions or subsequent changes made by the client or a third party. This guarantee applies only if included in the quotation.
How much does performance optimisation cost in Brussels?
The packages shown cover auditing, implementation or ongoing monitoring. The final scope depends on the stack, number of templates and third-party scripts. No generic ROI or payback period is promised.
What is the difference between Lighthouse and Core Web Vitals?
Lighthouse simulates a visit and provides several lab audits. The Core Web Vitals LCP, CLS and INP can be measured in the field, including through the Chrome UX Report, at the 75th percentile. A website can therefore show different results depending on the tool, period and audience. Read our Core Web Vitals guide.
How long does it take to improve performance?
That depends on the actual bottleneck: images, server, theme, third-party scripts, JavaScript or architecture. The audit establishes a baseline, then each change is measured. No point increase or timeframe is confirmed before this analysis.
Can performance optimisation break my website?
Every change carries a risk. A test environment, backups, visual and functional checks, versioned changes and a rollback plan reduce it. Apreliminary audit helps select proportionate interventions.
Why consider self-hosting fonts?
Self-hosting can reduce a third-party dependency and give more control over files, caching and subsets. The choice must also consider licences, the actual configuration and data protection obligations. It is not, on its own, evidence of compliance.
How can we maintain good performance over time?
Monitor field data where available, automate lab tests on stable pages and check new images, fonts and third-party tags. Ongoing maintenance can detect regressions without guaranteeing an unchanging score.